
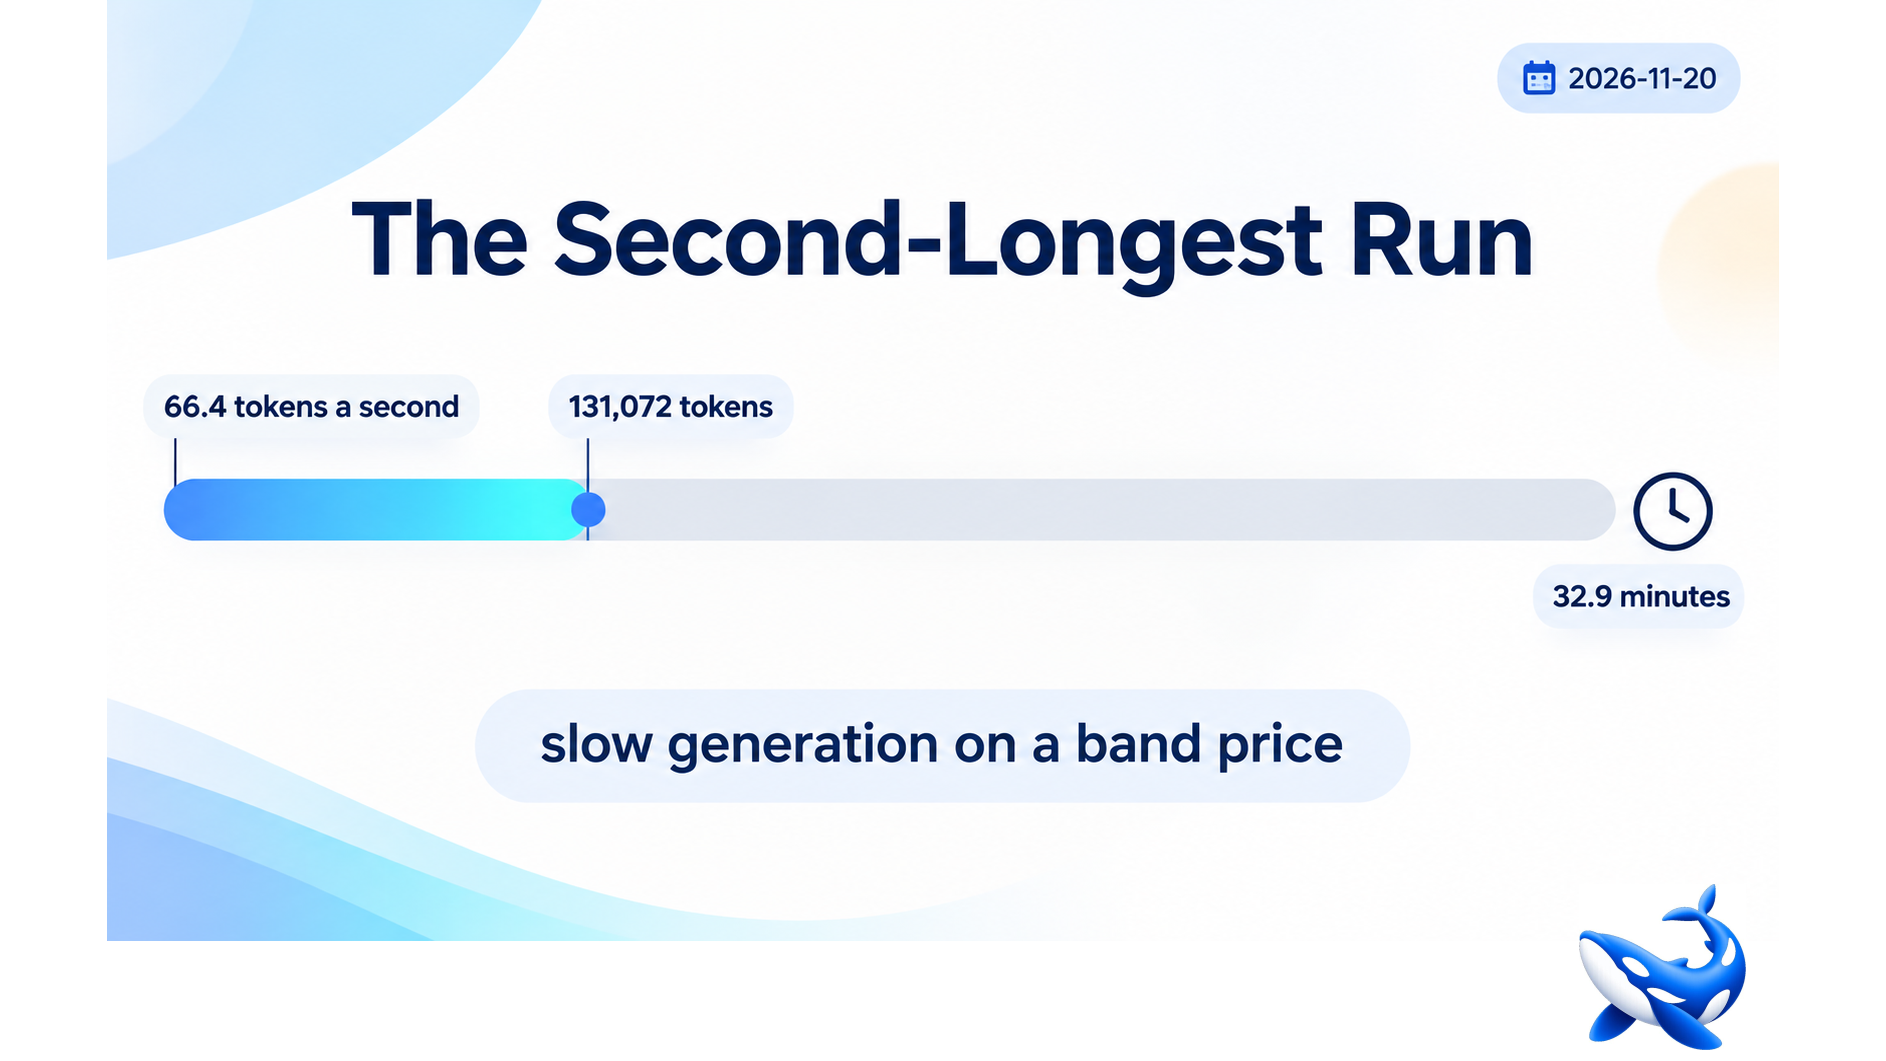
Sixty-six point four tokens a second is the second-slowest generation rate in the tier, and it turns a 131,072-token ceiling into a 32.9-minute run. OrcaRouter measures the rate on the same seven-day window as every other card here. This card’s is on OrcaCyber GLM 5.3 Flash throughput, and the arithmetic on it is simple enough to do on the back of an envelope.
The fill table
| card | ceiling | tok/s | fill (min) |
| Hy4 Flash | 65,536 | 182.1 | 6.0 |
| Hy4 | 65,536 | 135.1 | 8.1 |
| Zero 1.0 | 128,000 | 240.2 | 8.9 |
| Zero 1.5 | 128,000 | 195.6 | 10.9 |
| MiniMax M3.1 Flash | 131,072 | 110.3 | 19.8 |
| Ultra 1.0 | 131,072 | 109.2 | 20.0 |
| GLM 5.3 | 128,000 | 91.6 | 23.3 |
| Qwen3.8 Flash Next | 131,072 | 91.0 | 24.0 |
| Flash 1.0 | 393,216 | 210.9 | 31.1 |
| GLM 5.3 Flash | 131,072 | 66.4 | 32.9 |
| MiMo V2.6 Flash | 131,072 | 51.7 | 51.7 |
| K3.1 Pro | 943,718 | 81.4 | 193.2 |
Fill is the ceiling divided by the rate, in minutes. It is the longest a single call can run before it produces everything it is allowed to produce.
Thirty-two point nine minutes is longer than Flash 1.0’s 31.1 despite Flash 1.0 writing three times as many tokens — 393,216 against 131,072. The reason is the rate: 210.9 against 66.4, a factor of 3.2.
So the card’s problem is not the size of its ceiling. It is that the ceiling is ordinary and the rate is not.
What the rate costs per unit
| card | blend | tok/s | $/M/s |
| Hy4 Flash | $0.1228 | 182.1 | $0.00154 |
| Flash 1.0 | $1.0000 | 210.9 | $0.00759 |
| Hy4 | $1.0000 | 135.1 | $0.01184 |
| MiniMax M3.1 Flash | $1.0000 | 110.3 | $0.01450 |
| Qwen3.8 Flash Next | $1.0000 | 91.0 | $0.01758 |
| GLM 5.3 Flash | $1.0000 | 66.4 | $0.02409 |
| Zero 1.0 | $4.1250 | 240.2 | $0.03122 |
| MiMo V2.6 Flash | $1.0000 | 42.3 | $0.03783 |
| Zero 1.5 | $4.1250 | 195.6 | $0.03835 |
| GLM 5.3 | $3.5000 | 91.6 | $0.05458 |
| K3.1 Pro | $2.7500 | 81.4 | $0.06140 |
| Ultra 1.0 | $6.2500 | 109.2 | $0.09160 |
The column divides the blend by the rate, so it prices a million tokens per second of wall-clock. This card is sixth from the cheap end at $0.02409, 15.6× Hy4 Flash and 3.2× Flash 1.0.
Six cards share the $1.00 blend and this one is the most expensive of the six per unit of speed. Among price-identical siblings, the only lever left is the rate, and this card’s is the lowest of the group.
A buyer choosing within the band — the six cards at $0.80/$1.60 — is choosing entirely on speed and capability. On speed alone this is the weakest of the six, 3.2× slower than Flash 1.0 and 2.7× slower than Hy4.
Where a slow card is still the right answer
A 32.9-minute run only happens if someone asks for a 131,072-token answer. At a realistic output of 4,000 tokens the run is one minute, and at 500 tokens it is 7.5 seconds.
The published median supports the realistic case. A p50 of 4,144 ms with an implied answer of about 275 tokens — the median divided by the rate, our arithmetic — says the typical call is short. At 275 tokens the fill time question never arises.
But the published traffic says the card serves 5.42 billion tokens a week. If the typical response is about 275 tokens, that is roughly 20 million calls a week, or 33 a second. That is a high call rate for a 66-token-a-second card, and it implies the median call is genuinely small and the card is used in volume.
| quantity | value |
| 7-day tokens | 5.42 B |
| implied median answer | ~275 tokens |
| implied calls at that size | ~19.7 M |
| implied calls per second | ~32.6 |
| fill at 4,000-token output | 1.0 min |
| fill at 131,072-token output | 32.9 min |
The last two rows are the decision. A workload of short calls does not care about the ceiling run, and a workload of long ones should probably not use this card.
Comparing the two GLM cards
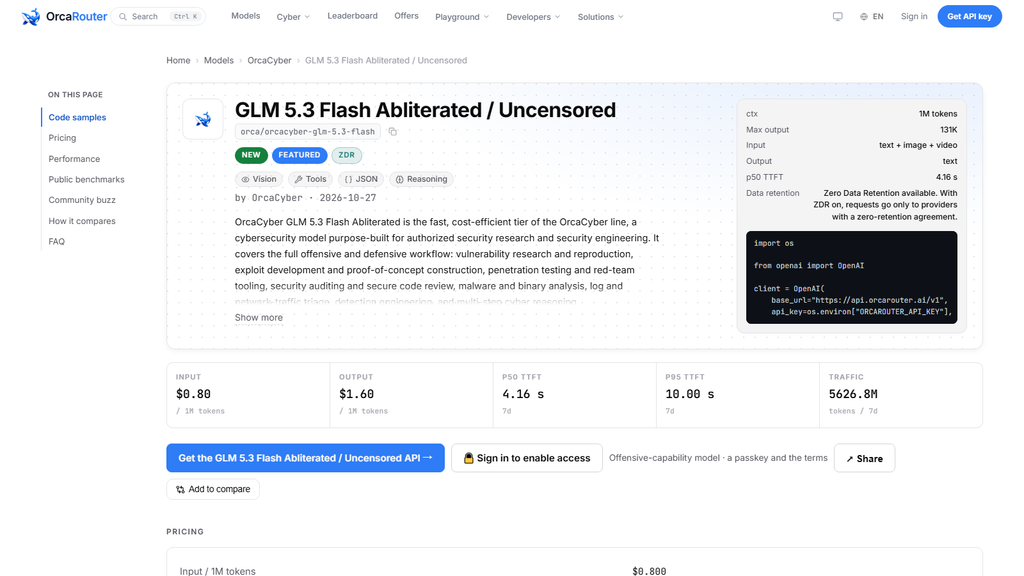
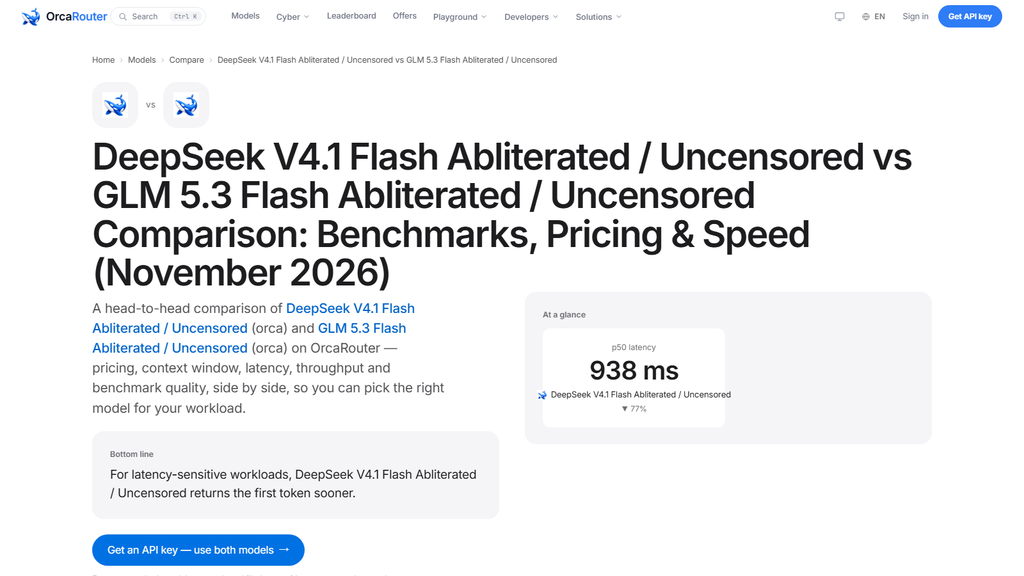
The card shares a name with GLM 5.3 and nothing else. The two differ on every column that matters.
| field | GLM 5.3 | GLM 5.3 Flash |
| blend | $3.5000 | $1.0000 |
| throughput | 91.6 tok/s | 66.4 tok/s |
| median | 3,411 ms | 4,144 ms |
| ceiling | 128,000 | 131,072 |
| window | 1,000,000 | 1,048,576 |
| input modalities | text | text, image, video |
| parameters | 11 | 21 |
| quality score | 9 / 10 | 8 / 10 |
| benchmark rows | 0 | 5 |
| cost per million per second | $0.05458 | $0.02409 |
The Flash card is cheaper by a factor of 3.5, slower by 28%, narrower on quality score, wider on capability, and the only one of the two with published evidence.
That is the shape of a deliberate product split rather than a generational upgrade. The premium card carries a higher quality score and less documentation; the Flash card carries five test rows and a third of the price.
For most buyers the Flash card is the right starting point on the published fields — it is cheaper, accepts more inputs, and can be evaluated against four sibling cards. The premium card’s case rests on a quality score that no test supports.
The two GLM cards, side by side on what a job costs
Same family name, a third of the price, and a slower engine.
| job | GLM 5.3 | GLM 5.3 Flash |
| 1 M-token read, cold | $3.0000 | $0.8000 |
| 1 M-token read, warm | $0.3000 | $0.1600 |
| 128,000-token write | $0.6400 | $0.2097 |
| full-window job, cold | $3.6400 | $1.0097 |
| full-window job, warm | $0.9400 | $0.3697 |
| fill time | 23.3 min | 32.9 min |
The Flash card does the same job for 28% of the price and takes 41% longer. That is a straightforward trade and it favours Flash on almost every workload.
Where the premium card wins is the fill time, and 23.3 minutes is inside a queue timeout that 32.9 would blow through. A pipeline that must complete a ceiling-length job within half an hour cannot use the Flash card for it.
Beyond that the comparison runs the other way on every field. GLM 5.3 Flash accepts image and video input; the premium card is text-only. The Flash card exposes 21 parameters against 11. The Flash card publishes five benchmark rows against none.
So the premium card’s case rests on a quality score of 9 and a 9.6-minute faster ceiling run. Both are published, and neither is a capability the cheaper card lacks.
The practical split between the two GLM cards turns on one number: whether the pipeline’s slowest acceptable single call is above or below thirty minutes. Above it, the Flash card is usable and cheaper. Below it, the ceiling-length job has to move to the premium card, and the premium card’s lack of benchmark rows becomes the price of that move. Neither card is better in the abstract; they sit on opposite sides of a deployment boundary.
OrcaCyber GLM 5.3 Flash generates at 66.4 tokens a second, the second-slowest rate in the tier, which turns its 131,072-token ceiling into a 32.9-minute run — longer than Flash 1.0’s 31.1 minutes despite writing a third as many tokens.
At the band price that is $0.02409 per million per second, the most expensive of the six price-identical cards and 3.2× Flash 1.0. Its published traffic implies roughly 20 million short calls a week, which is the workload the card is shaped for; the ceiling run is the case it handles worst.
Sourcing note: the throughput, ceiling, window, price rows, latency percentiles, error rate, token volume, parameter count, input modalities and benchmark rows are read from the OrcaCyber GLM 5.3 Flash and GLM 5.3 model APIs and card pages on orcarouter.ai on 2026-11-20, with throughput, latency and error rates being OrcaRouter production telemetry for the seven days to that date. The fill times, per-unit-of-speed costs, implied answer lengths and call-rate estimates are our own arithmetic at a 3:1 input-to-output mix. No competitor product is named or compared. Checked 2026-11-20.